Image Details
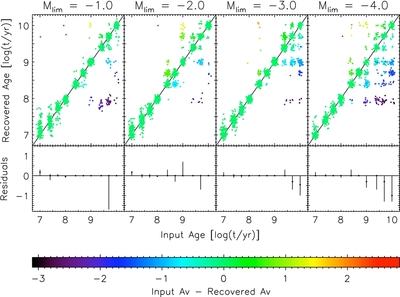
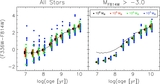
Caption: Figure 6.
Recovered vs. input age of the simulated test clusters, color coded by the difference in recovered vs. input extinction, for four values of M lim in the F814W filter. To clearly see the distribution of recovered values, Gaussian noise with a dispersion of σ = 0.05 dex in each direction was added in the upper panels. The bottom panels show the median for the residuals in log( t) for all clusters at each input age, along with the 16th and 84th percentile of the residuals.
Other Images in This Article

Copyright and Terms & Conditions
© 2012. The American Astronomical Society. All rights reserved.
Copyright ©
2025 Astronomy Image Explorer. All Rights Reserved.