Image Details
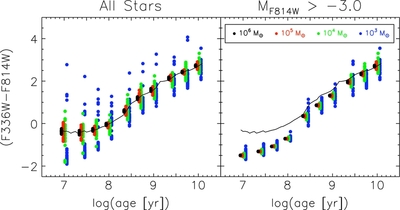
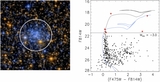
Caption: Figure 5.
Colors as a function of age for simulated solar-metallicity clusters at four fiducial masses. The left panel shows the total integrated color, while the right panel shows only the unresolved color (excluding stars with F814W magnitudes brighter than M lim = −3). Thirty clusters are plotted for each age. The break in the right panel at log( t) ⩾ 8.4 is due to M lim being above the main-sequence turnoff for older clusters, such that some evolved stars are included in the unresolved component. For clarity, all the 10 6 M ☉ clusters were shifted to the left by 0.06 dex, the 10 5 M ☉ clusters were shifted to the left by 0.02 dex, the 10 4 M ☉ clusters were shifted to the right by 0.02 dex, and the 10 3 M ☉ clusters were shifted to the right by 0.06 dex. The black curve shows the colors predicted from continuously populated Padova SSP models (Marigo et al. 2008; Girardi et al. 2010).
Other Images in This Article

Copyright and Terms & Conditions
© 2012. The American Astronomical Society. All rights reserved.