Image Details
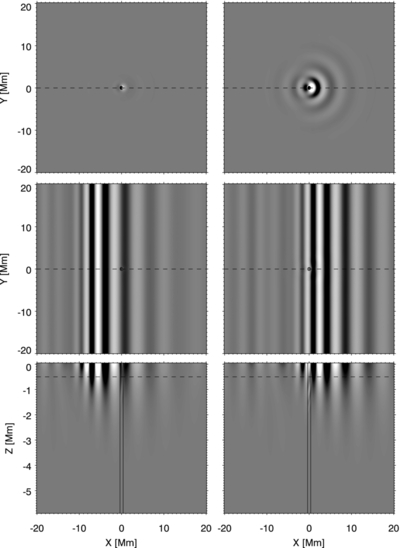
Caption: Figure 5.
Vertical velocity at t = 80 minutes (left panels) and t = 100 minutes (right panels) for the simulation with a 370 km radius magnetic flux tube. Top: horizontal cut at z = −0.5 Mm of the scattered wave; middle: horizontal cut at z = −0.5 Mm of the full wave field; bottom: vertical cut at y = 0 Mm for the full wave field. The white–black colors mean positive–negative velocity directions; the gray scale in the top panels is 10 times more saturated. In the top and middle panels the circle at x = 0 Mm and y = 0 Mm indicates the location of the tube, while the dashed line is the position of the cut shown in the bottom panels. In the bottom panels, the vertical solid lines are the boundaries of the tube, and the horizontal dashed line is the position of the cuts shown in the top and middle panels. In the full wave field plots the tube modes are hardly visible because their amplitude is small compared to the f-mode. See Figure 4 for a detailed plot of the tube wave velocities.
Other Images in This Article

Copyright and Terms & Conditions
© 2012. The American Astronomical Society. All rights reserved.