Image Details
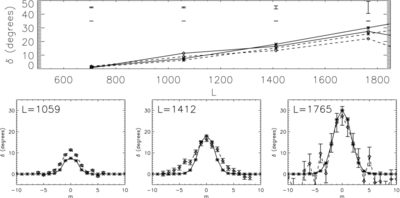
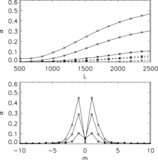
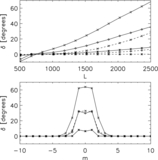
Caption: Figure 11.
Top panel: variation of the phase shift with L for the azimuthal orders m = 0 (solid line) and m = 1 (dashed line). The bars above each L with data indicate the errors; the bottom one corresponds to the simulation, and the top one is the error from the observations. Bottom panels: variation of the phase shift with m at different L; from left to right L = 1056, 1412, and 1765. In all panels asterisks correspond to the simulation with a flux tube with a 560 km radius after averaging, and diamonds to the observations.
Other Images in This Article
Copyright and Terms & Conditions
© 2012. The American Astronomical Society. All rights reserved.
Copyright ©
2025 Astronomy Image Explorer. All Rights Reserved.