Image Details
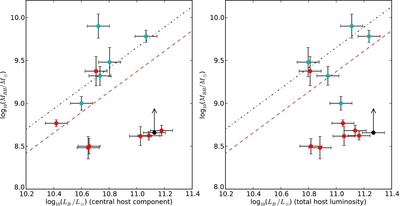
Caption: Figure 4.
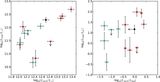
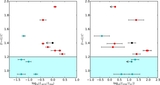
Black hole mass vs. host luminosity for our red quasars. Left: using the model fits to the brightest host galaxy component of Urrutia et al. (2008) and right: using the total host luminosity, including the flux in disturbed, outlying components not well fit by the model. Cyan symbols denote objects accreting at <30% of the Eddington rate, red points objects with accretion rates >30% Eddington, the object with a limit only on its black hole mass (assuming Eddington-limited accretion), F2M1118-0033, is shown as a black dot. The red dashed line is the local black hole mass–bulge luminosity relation from van der Marel (1999), the black dashed line is the relationship at z ~ 0.7 (interpolated from Merloni et al. 2010). Most of our high accreting object lie below the black hole mass–bulge luminosity relation.
Other Images in This Article
Copyright and Terms & Conditions
© 2012. The American Astronomical Society. All rights reserved.