Image Details
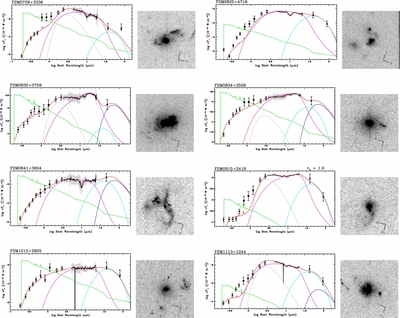
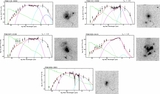
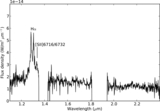
Caption: Figure 3.
Broadband rest-frame spectral energy distributions (SEDs) of the red quasars. The five photometry measurements from the SDSS are shown as squares, the ones from 2MASS as filled circles, the ones from WISE Band 1+2 as open circles, and the ones from MIPS as stars (three of the low-redshift quasars were not observed at MIPS 160 μm). Also shown is the IRS spectrum with a corresponding gray error area. The fitted SEDs of the quasars are shown in red. They are builtup from a quasar component (in green) and AGN hot dust component (pink), both of which are reddened by an SMC extinction law. Furthermore a very hot quasar dust component (gray), a warm dust component (cyan), and a cold dust component (blue) are added. The corresponding HST image is shown to the right of each SED as an 7 × 7 arcsec gray-scale image.
Other Images in This Article
Copyright and Terms & Conditions
© 2012. The American Astronomical Society. All rights reserved.