Image Details
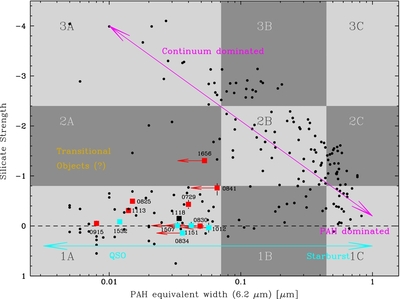
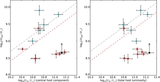
Caption: Figure 2.
Diagnostic diagram of Spoon et al. (2007) with their sources plotted as small filled circles. Our quasars are plotted as larger squares with the PAH values showing arrows being upper limits. Usually sources cluster along two tracks: the diagonal continuum track from 1C to 3A (magenta) spanning from starburst to ULIRG-type systems and the activity track from 1A to 1C (cyan) spanning from QSOs to starburst galaxies. Most of the quasars are found in quadrant 1A, but some have silicate troughs deep enough to be in quadrant 2A, which Spoon et al. (2007) speculates to be transitional objects.
Other Images in This Article
Copyright and Terms & Conditions
© 2012. The American Astronomical Society. All rights reserved.
Copyright ©
2025 Astronomy Image Explorer. All Rights Reserved.