Image Details
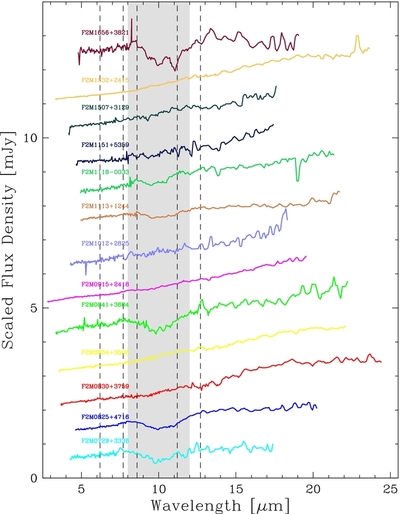
Caption: Figure 1.
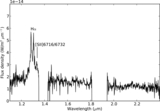
Stacked IRS rest-frame spectra of red quasars. The spectra are normalized to 1 at 15 μm and offset. The dashed lines denote the central wavelengths of the family of PAH emission features at 6.2, 7.7, 8.6, 11.2, and 12.7 μm. The shaded region represents the typical region (8.0–12.0 μm) where the 9.7 μm silicate absorption feature is seen.
Other Images in This Article
Copyright and Terms & Conditions
© 2012. The American Astronomical Society. All rights reserved.
Copyright ©
2025 Astronomy Image Explorer. All Rights Reserved.