Image Details

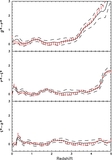
Caption: Figure 9.
Redshift evolution of the quasar space density. Red, green, blue, magenta, light blue, orange, black, and purple lines are the space density of quasars with M 1450 = −20, −21, −22, −23, −24, −25, −26, and −27, respectively. Filled squares, open circles, filled circle, and open triangles denote the results of different quasar surveys, as described in the upper-left side of the panel (see the main text for details). For comparison, the results of COSMOS and previous surveys are connected by the dashed lines while the results of NDWFS and DLS (Glikman et al. 2011) are connected by the dotted lines.
Other Images in This Article
Copyright and Terms & Conditions
© 2012. The American Astronomical Society. All rights reserved.