Image Details
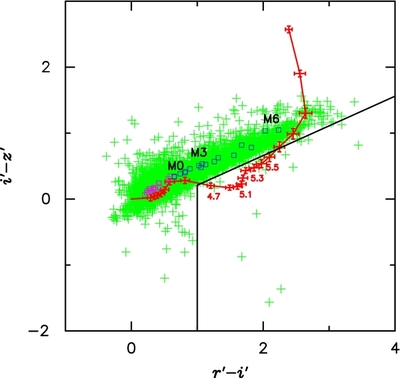
Caption: Figure 1.
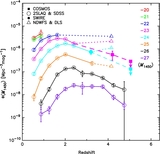
Two-color diagram of
r′ −
i′ and
i′ −
z′ that is used for our quasar selection. Green plus signs denote point sources with
 . Blue and magenta squares denote colors of M- and K-type stars (Pickles 1998), respectively. The red line is the median track
of the model quasar colors. The red error bars show the standard deviation of the
r′ −
i′ and
i′ −
z′ colors in our model quasar spectra. The black solid line shows our photometric criteria used to select quasar candidates
at
z ~ 5.
. Blue and magenta squares denote colors of M- and K-type stars (Pickles 1998), respectively. The red line is the median track
of the model quasar colors. The red error bars show the standard deviation of the
r′ −
i′ and
i′ −
z′ colors in our model quasar spectra. The black solid line shows our photometric criteria used to select quasar candidates
at
z ~ 5.
Other Images in This Article
Copyright and Terms & Conditions
© 2012. The American Astronomical Society. All rights reserved.
Copyright ©
2025 Astronomy Image Explorer. All Rights Reserved.