Image Details
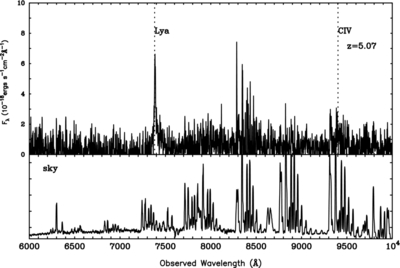
Caption: Figure 2.
Reduced spectrum of object No. 11 in Table 1 (upper panel) and typical sky spectrum (lower panel). The dotted lines show the expected wavelengths of quasar emission lines: Lyα λ1216 and C iv λ1549.
Other Images in This Article
Copyright and Terms & Conditions
© 2012. The American Astronomical Society. All rights reserved.
Copyright ©
2025 Astronomy Image Explorer. All Rights Reserved.