Image Details
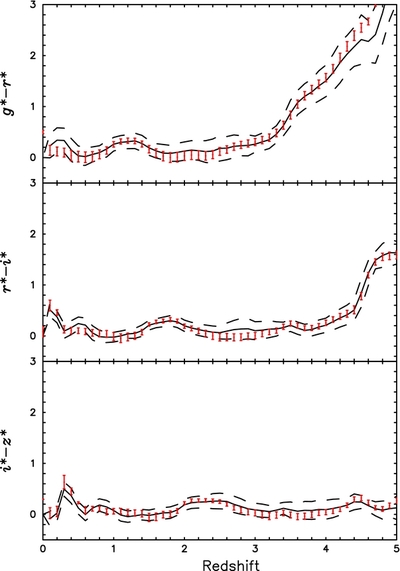
Caption: Figure 4.
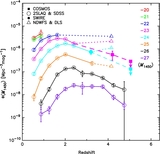
Comparison between the empirical and simulated quasar colors. Solid black lines show the empirical mean colors of the SDSS DR7 quasars. Dashed black lines show 1σ dispersions of the SDSS DR7 quasar colors. Red points show the simulated quasar colors. Red vertical lines show the standard deviation of simulated quasar colors, which do not include photometric errors.
Other Images in This Article
Copyright and Terms & Conditions
© 2012. The American Astronomical Society. All rights reserved.
Copyright ©
2025 Astronomy Image Explorer. All Rights Reserved.