Image Details
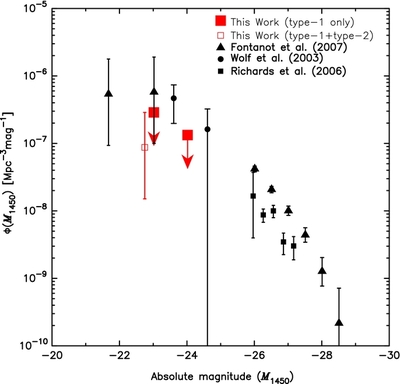
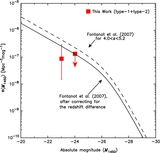
Caption: Figure 6.
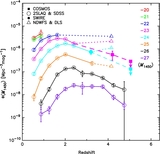
z ~ 5 quasar luminosity functions. The red filled squares show our results (1σ confidence limits on the quasar space density) and the red open square shows the quasar space density when we include a type-2 quasar at z ~ 5.07. For clarifying the data plots in the figure, the open red square is slightly shifted to the left direction to avoid the overlap of the error bars. Triangles, squares, and circles denote the results reported by Fontanot et al. (2007), Richards et al. (2006), and Wolf et al. (2003), respectively.
Other Images in This Article
Copyright and Terms & Conditions
© 2012. The American Astronomical Society. All rights reserved.
Copyright ©
2025 Astronomy Image Explorer. All Rights Reserved.