Image Details
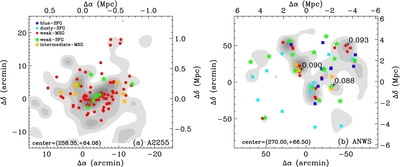
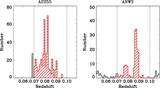
Caption: Figure 24.
Spatial distribution of each galaxy type in Figure 23, on the smoothed galaxy number density maps for all supercluster member galaxies in A2255 (left) and in the ANWS (right). In the right panel, the three "+" signs indicate the center of X-ray detected groups with the mean redshifts given (Henry et al. 2006). North is up and east is to the left.
Other Images in This Article
Show More
Copyright and Terms & Conditions
© 2012. The American Astronomical Society. All rights reserved.
Copyright ©
2025 Astronomy Image Explorer. All Rights Reserved.