Image Details
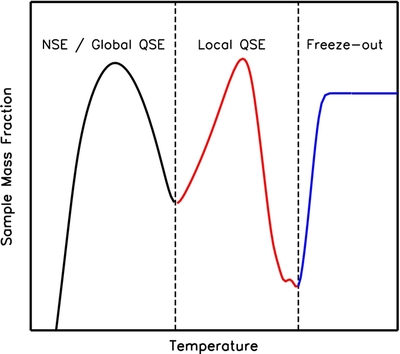
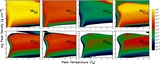
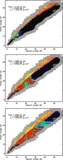
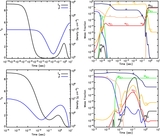
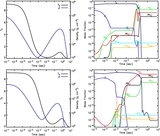
Caption: Figure 9.
Mass fraction schematic for decreasing temperature, where the arc structure is illustrated. Such mass fraction profiles are representative of the chasm, α-rich, α p-rich, and α n-rich freeze-outs. The first arc (black) describes the mass fraction trend during a large-scale QSE state. The second arc (red) describes the mass fraction trend once the isotope is outside the large equilibrium cluster, and its trends may be explained by local equilibrium states (local QSE). The blue ascending track is denoted as third arc, and is related to a mixture of local QSE and non-equilibrium nucleosynthesis. Mass fractions during an α-rich freeze-out have only an ascending track past the first arc, while for the chasm region the mass fractions have only one arc.
Other Images in This Article
Copyright and Terms & Conditions
© 2011. The American Astronomical Society. All rights reserved.