Image Details
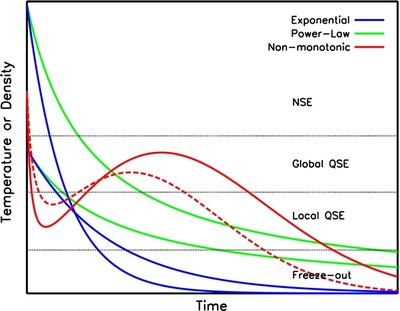
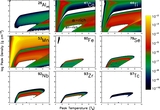
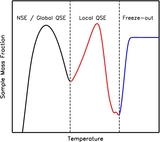
Caption: Figure 1.
Schematic temperature or density evolution for the exponential, power-law, and non-monotonic profiles. Passages through different burning regimes for various peak conditions are indicated. The dashed red curve illustrates the impact of variations to the values of the local extremum points for the same peak conditions.
Other Images in This Article
Copyright and Terms & Conditions
© 2011. The American Astronomical Society. All rights reserved.
Copyright ©
2025 Astronomy Image Explorer. All Rights Reserved.