Image Details
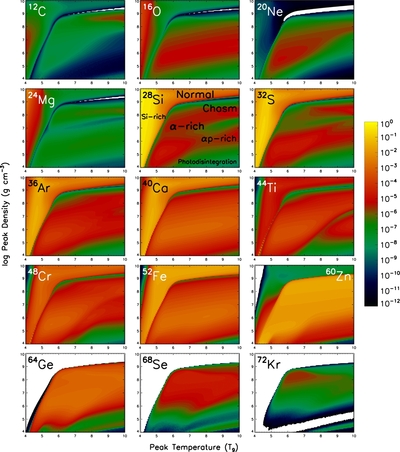
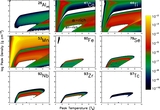
Caption: Figure 2.
Final mass fractions of the α-chain isotopes ( 56Ni omitted) in the peak temperature–density plane for the exponential profile at Y e = 0.5. The white colored space corresponds to values below the color scale shown. From left to right, the first row corresponds to 12C, 16O, and 20Ne, the second row corresponds to 24Mg, 28Si, and 32S, the third row corresponds to 36Ar, 40Ca, and 44Ti, the fourth row corresponds to 48Cr, 52Fe, and 60Zn, and the fifth row corresponds to 64Ge, 68Se, and 72Kr.
Other Images in This Article
Copyright and Terms & Conditions
© 2011. The American Astronomical Society. All rights reserved.
Copyright ©
2025 Astronomy Image Explorer. All Rights Reserved.