Image Details
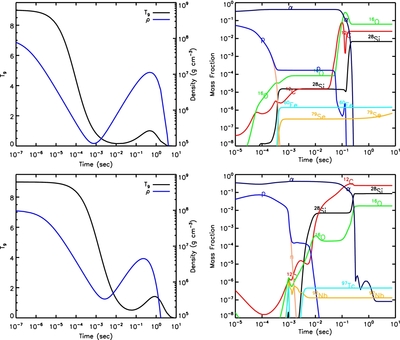
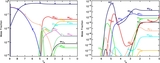
Caption: Figure 11.
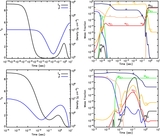
Non-monotonic temperature and density trajectories (left column) and key mass fraction profiles (right column) for initial conditions T 9 = 9, ρ = 10 8 g cm −3, and Y e = 0.50. The top row is a profile where the 60Fe yield is approximately maximized, while the profile at the bottom row tends to maximize the 97Tc yield within our data set.
Other Images in This Article
Copyright and Terms & Conditions
© 2011. The American Astronomical Society. All rights reserved.
Copyright ©
2025 Astronomy Image Explorer. All Rights Reserved.