Image Details
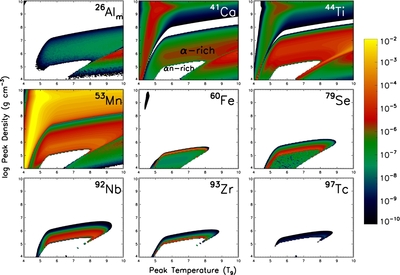
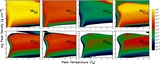
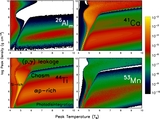
Caption: Figure 5.
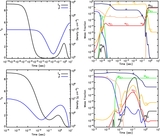
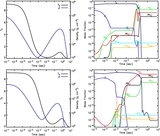
Final mass fractions of select radioactivities in the peak temperature–density plane for the exponential profile at Y e = 0.48. The white colored space corresponds to values below the color scale shown. From left to right, the first row corresponds to 26Al m, 41Ca, and 44Ti, the second row corresponds to 53Mn, 60Fe, and 79Se, and the third row corresponds to 92Nb, 93Zr, and 97Tc. The α-rich and α n-rich freeze-out regions are labeled on the temperature–density plane for 41Ca.
Other Images in This Article
Copyright and Terms & Conditions
© 2011. The American Astronomical Society. All rights reserved.
Copyright ©
2025 Astronomy Image Explorer. All Rights Reserved.