Image Details
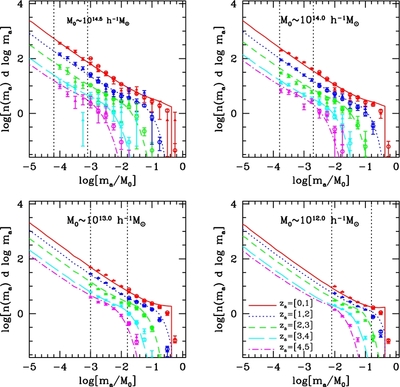
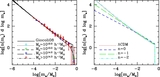
Caption: Figure 8.
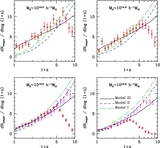
Un-evolved mass function of subhalos accreted within the redshift ranges [0, 1] (solid lines), [1, 2] (dotted), [2, 3] (dashed), [3, 4] (long dashed), and [4, 5] (dot-dashed), for host halos of different masses, as indicated in each panel. Here model predictions assuming a ΛCDM cosmology are compared with the results obtained from the 300 h −1 Mpc box N-body simulations of the same cosmology (open circles). For comparison, results obtained from the 100 h −1 Mpc box simulation are also shown (as filled triangles) for cases in which the statistics are sufficiently good. The vertical lines in each panel correspond to the mass of 100 particles in the two simulations, as in Figure 4).
Other Images in This Article

Copyright and Terms & Conditions
© 2011. The American Astronomical Society. All rights reserved.