Image Details
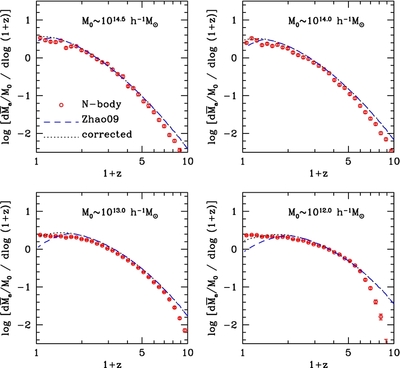
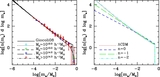
Caption: Figure 3.
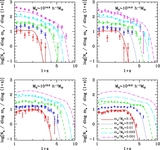
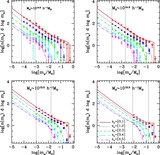
Mean mass accretion rate of host halos with different final masses. The open circles in each panel show the rate in terms of dlog (1 + z) obtained from N-body simulations, normalized by the mass of the host halo, with error bars obtained from 200 bootstrap resampling of the host halos. The dashed line is the model prediction of Zhao et al. (2009), while the dotted line shows the corrected mass accretion rate according to Equation (22).
Other Images in This Article

Copyright and Terms & Conditions
© 2011. The American Astronomical Society. All rights reserved.
Copyright ©
2025 Astronomy Image Explorer. All Rights Reserved.