Image Details
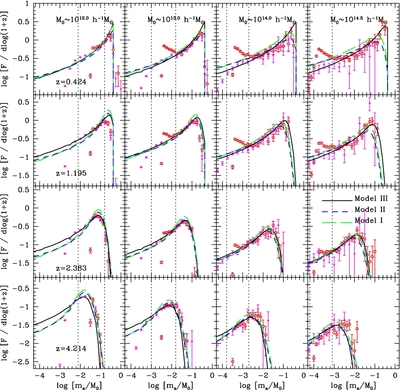
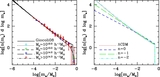
Caption: Figure 4.
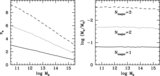
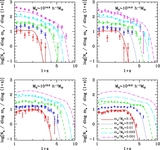
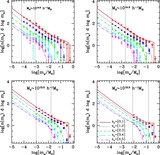
Conditional mass distribution of subhalos in host halos of different masses (different columns) at different redshifts (different rows). The symbols are results from N-body simulations, with error bars obtained from 200 bootstrap resampling of the host halos. In each panel, results are shown for both high-resolution (100 h −1 Mpc box; filled triangles) and low-resolution (300 h −1 Mpc box; open circles) simulations. In the high-resolution simulation, unbound particles are removed (see the text for details). The long-dashed, dashed, and solid lines show the predictions of Models I, II, and III respectively. Finally, the vertical dotted lines in each panel correspond to the mass limit of 100 particles in the high-resolution (left line) and low-resolution (right line) simulations, respectively. Note that bin widths in different columns are different.
Other Images in This Article

Copyright and Terms & Conditions
© 2011. The American Astronomical Society. All rights reserved.