Image Details
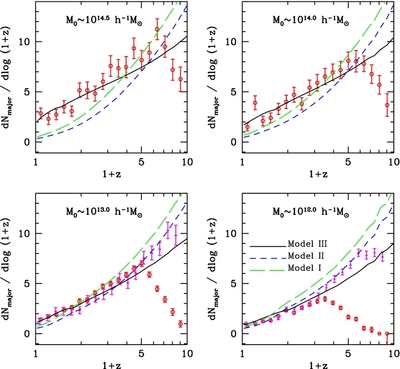
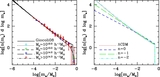
Caption: Figure 5.
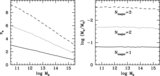
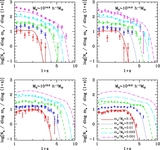
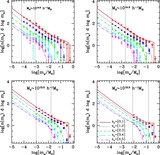
Major merger events per unit log (1 + z) as a function of z. The symbols show results obtained from simulations, while the three curves in each panel show the predictions of Models I, II, and III. For comparison, results for both the high-resolution (which extends to higher redshift; filled triangles) and low-resolution (open circles) simulations are shown for cases in which the statistics are sufficiently good.
Other Images in This Article

Copyright and Terms & Conditions
© 2011. The American Astronomical Society. All rights reserved.
Copyright ©
2025 Astronomy Image Explorer. All Rights Reserved.