Image Details
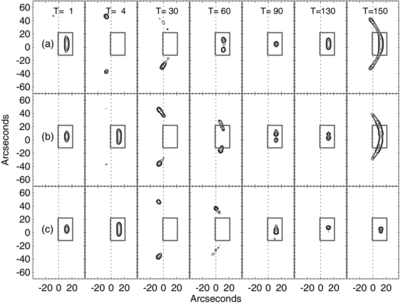
Caption: Figure 13.
Total hard X-ray emission in the 3–6 keV passband. Each plot shows the median emission simulated in an instrument with 7'' pixels and a Gaussian point-spread function with an FWHM of 3 pixels. Contours enclose the 40%, 60%, and 80% levels. Each row corresponds to a pitch-angle distribution: (a) γ PA = −4, (b) γ PA = 0, and (c) γ PA = 4. Each column corresponds to a different time in the simulated flare's evolution. Note the hard X-ray loop top source at t = 1 s for each pitch-angle distribution. This initial loop top source is due to the collisions and thermalization of low energy particles deposited at the loop apex. The initial loop top source is very short lived in the γ PA = −4 case but longer lived in the γ PA = 0 and γ PA = 4 cases. Note that each case generates hard X-ray sources that steadily move up the legs of the loop. In the γ PA = −4 and γ PA = 0 cases, the loop top source is no longer apparent, with the emission being dominated by very low level thermal emission. In the γ PA = 4 case, however, the loop top source is still very strong and lasts for several minutes. Intensities in the box shown in each plot are summed to provide a light curve shown in Figure 14.
Other Images in This Article


Show More
Copyright and Terms & Conditions
© 2011. The American Astronomical Society. All rights reserved.