Image Details
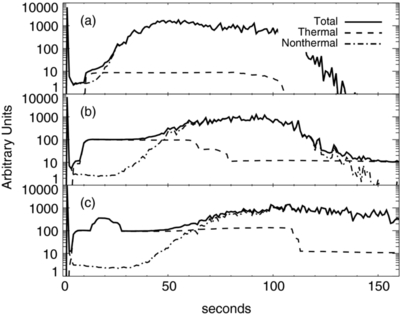
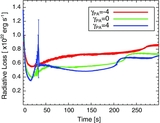
Caption: Figure 14.
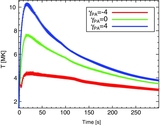
Light curves of the 3–6 keV loop top emission of simulated flares. Each row corresponds to a pitch-angle distribution: (a) γ PA = −4, (b) γ PA = 0, and (c) γ PA = 4. The loop top 3–6 keV emission for the γ PA = −4 is almost all non-thermal, while the γ PA = 0 and γ PA = 4 cases are a mixture of thermal and non-thermal emission, with non-thermal emission dominating later in the flare. The bump in the thermal emission in the γ PA = 4 case at t = 1–28 s is due to its much higher apex temperature at that time which yields more emission in the 3–6 keV passband.
Other Images in This Article

Show More
Copyright and Terms & Conditions
© 2011. The American Astronomical Society. All rights reserved.
Copyright ©
2025 Astronomy Image Explorer. All Rights Reserved.