Image Details
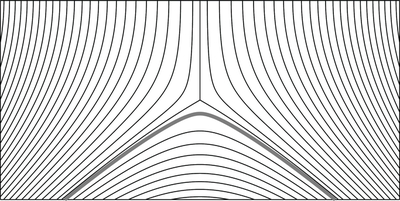
Caption: Figure 5.
Field lines from the Green current sheet model. The vertical line represents the current sheet in the half-plane. The thick gray line illustrates the field line chosen for the basis of the simulated loop's geometry. From this figure it is easy to see why this geometry is called Y-type. The current sheet connects with the separatrix field lines, just above the gray line, to form an inverted Y.
Other Images in This Article

Show More
Copyright and Terms & Conditions
© 2011. The American Astronomical Society. All rights reserved.
Copyright ©
2025 Astronomy Image Explorer. All Rights Reserved.