Image Details
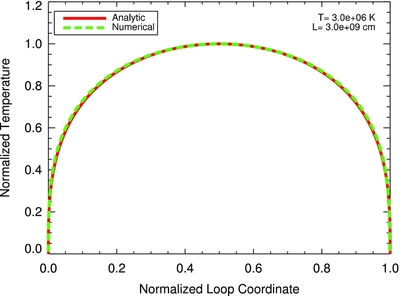
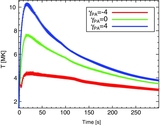
Caption: Figure 3.
Plot showing the normalized temperature profile for a uniformly heated loop. The red line shows the analytic solution based on Martens (2010) and the green dashed line shows the result from SHrEC.In this simulation saturated flux effects are not taken into account. The differences between the numerical and analytic calculations are less than 2%.
Other Images in This Article
Show More
Copyright and Terms & Conditions
© 2011. The American Astronomical Society. All rights reserved.
Copyright ©
2025 Astronomy Image Explorer. All Rights Reserved.