Image Details
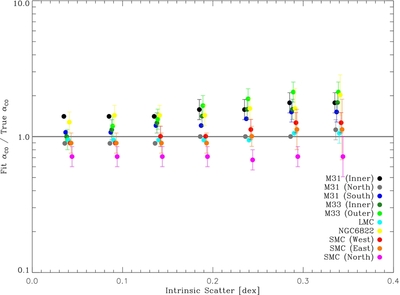
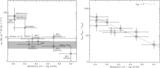
Caption: Figure 8.
Fits to simulated data. The y-axis gives the mean best-fit α CO divided by the true value (known by construction) as a function of the intrinsic scatter in the dust–gas relation ( x-axis). Error bars show the rms scatter in the best-fit α CO. The horizontal line at 1 shows a perfect match between true and best-fit α CO. Different colors indicate different systems. For realistic intrinsic scatter (≲ 0.2 dex, see Table 2), we recover the true α CO with better than 40% accuracy in all cases.
Other Images in This Article
Copyright and Terms & Conditions
© 2011. The American Astronomical Society. All rights reserved.
Copyright ©
2025 Astronomy Image Explorer. All Rights Reserved.