Image Details
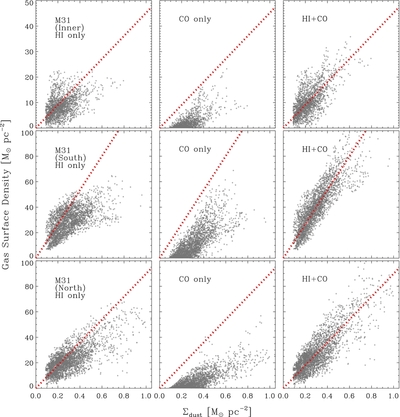
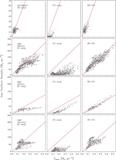
Caption: Figure 3.
Scatter plots showing Σ gas as a function of Σ dust for M 31. The columns show the relationship between dust ( x-axis) and (left) H i, (middle) H 2 derived from CO using our best-fit α CO, and (right) total (H i + H 2) gas. Our best-fit α CO yields reasonable linear scalings between total gas and dust in each system (the red line shows the median δ GDR), usually a clear improvement on the relationship between dust and either phase alone.
Other Images in This Article
Copyright and Terms & Conditions
© 2011. The American Astronomical Society. All rights reserved.
Copyright ©
2025 Astronomy Image Explorer. All Rights Reserved.