Image Details
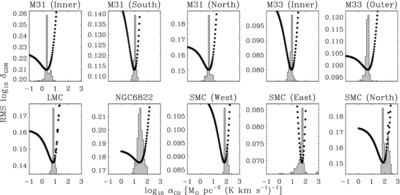
Caption: Figure 2.
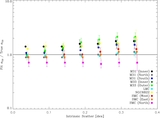
Scatter in log 10δ GDR as a function of α CO; each dot shows a calculation for a trial α CO. The shaded histograms in the background show the distribution of best-fit α CO achieved across bootstrapping and variation of assumptions; they give some indication of the likelihood of a given α CO describing the data.
Other Images in This Article
Copyright and Terms & Conditions
© 2011. The American Astronomical Society. All rights reserved.
Copyright ©
2025 Astronomy Image Explorer. All Rights Reserved.