Image Details
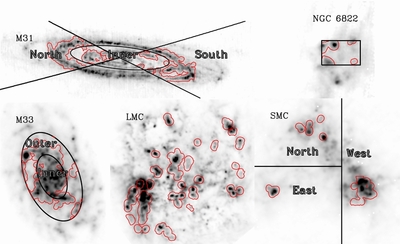
Caption: Figure 1.
Images of our targets at 160 μm (gray scale) with the region considered enclosed by a red contour. In M 31, M 33, and the SMC, black lines separate regions that we treat separately and labels indicate how we refer to these in the text.
Other Images in This Article
Copyright and Terms & Conditions
© 2011. The American Astronomical Society. All rights reserved.
Copyright ©
2025 Astronomy Image Explorer. All Rights Reserved.