Image Details
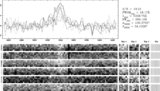
Caption: Figure 8.
Four tests of our three-dimensional Monte Carlo resonant scatter code. Top left: the emergent Lyman-α spectra from uniform density, static halos at T= 10 K with various line center edge-to-center optical depths. The histograms are from our simulations. The lines are from function 9 in Dijkstra et al. (2006a). Top right: the redistribution function for Lyman-α scattering with a gas temperature of T= 10 4 K. The histogram is our code output while the curves are from theory in Hummer (1962) and Lee (1974). Bottom left: the number of scatterings necessary for a Lyman-α photon to escape a neutral, static slab of H i. The points are from our simulations. The line is from theory (Harrington 1973). Bottom right: the emergent Lyman-α spectrum from an infinite, uniform density H i halo under Hubble expansion at z=10 with T = 10 K.
Other Images in This Article
Copyright and Terms & Conditions
© 2009. The American Astronomical Society. All rights reserved.