Image Details
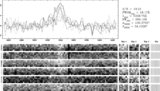
Caption: Figure 2.
Spectra of both our IFS data and resonant scattering simulation from select fibers. The thin dotted line indicates the redshift measured for 21 cm absorption. Solid: observed. Thick dotted: simulated. Top: fiber 4, representative of most of the halo area where neither cone directly projects. Middle: fiber 7, representative of regions spanned by the near photoionized cone. Bottom left: fiber 14, representative of regions spanned by the rear photoionized cone. Only these regions show a bimodal line profile. Bottom right: a region in the simulation near fiber 14. While we did not have a fiber on this exact position, the bimodal spectrum here is a good match to its neighbor in fiber 14.
Other Images in This Article
Copyright and Terms & Conditions
© 2009. The American Astronomical Society. All rights reserved.