Image Details
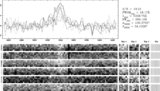
Caption: Figure 3.
Log contours of surface brightness. Left: fits to the data. The primary and secondary peaks are respectively dark and light. Middle: the simulations described in Section 3, where the same type of spectral decomposition as for the data between primary and secondary is performed. Right: the same simulations, but now with a decomposition regardless of the spectral signature but where the dark contour follows emission from the near photoionized cone and the light contour from the rear photoionized cone. This optimistically represents a clean detangling of spectral signal that a model with more optimized parameters may accomplish.
Other Images in This Article
Copyright and Terms & Conditions
© 2009. The American Astronomical Society. All rights reserved.