Image Details
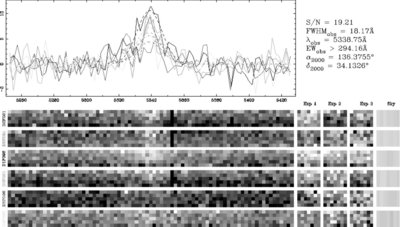
Caption: Figure 4.
Joint detection of Lyman-α emission in a subset of the central fibers. The equivalent width limit is shown. Each row in the figure's bottom half corresponds to the spectrum from a fiber with a unique position on sky. In the labeling of Figure 1, these fibers are numbers 4, 15, 3, 7, 14, and 11 from top to bottom.
Other Images in This Article
Copyright and Terms & Conditions
© 2009. The American Astronomical Society. All rights reserved.
Copyright ©
2026 Astronomy Image Explorer. All Rights Reserved.