Image Details
Caption: Figure 6.
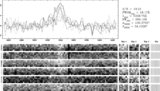
Predicted 21 cm maps for B2 0902+34. The 1.65 GHz data of Carilli (1995) are plotted as the dashed contour as a likely source distribution. Top left: column density where the log of N(H i) in cm −2 is given. Top right: velocity dispersion in km s −1. Bottom: velocity shift in km s −1.
Other Images in This Article
Copyright and Terms & Conditions
© 2009. The American Astronomical Society. All rights reserved.
Copyright ©
2026 Astronomy Image Explorer. All Rights Reserved.