Image Details
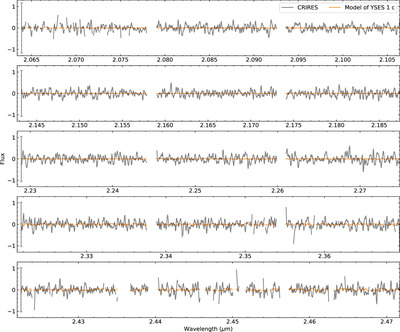
Caption: Figure 14.
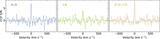
CRIRES+ observations and best-fit model spectrum of YSES 1 c. The observations in gray are convolved with the rotational broadening kernel for better visualization. The typical uncertainties of the data are shown in gray error bars on the left-hand side. The planetary signal is buried in the noise in individual channels.
Other Images in This Article


Show More
Copyright and Terms & Conditions
© 2024. The Author(s). Published by the American Astronomical Society.
Copyright ©
2025 Astronomy Image Explorer. All Rights Reserved.