Image Details
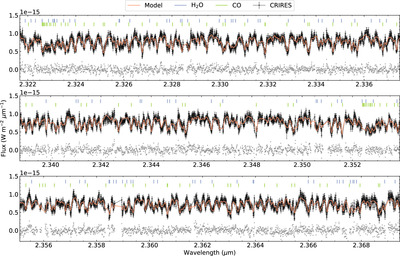
Caption: Figure 3.
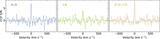
One spectral order of CRIRES+ observations of YSES 1 b from 2.32 to 2.37 μm. The observations are shown in black data points with error bars. Overplotted is the best-fit model obtained with retrieval analyzes. We annotated the positions of absorption features from H2O and CO with short bars on the top of each panel. The observational residuals (data minus model) are shown with scattered dots in gray.
Other Images in This Article


Show More
Copyright and Terms & Conditions
© 2024. The Author(s). Published by the American Astronomical Society.
Copyright ©
2025 Astronomy Image Explorer. All Rights Reserved.