Image Details
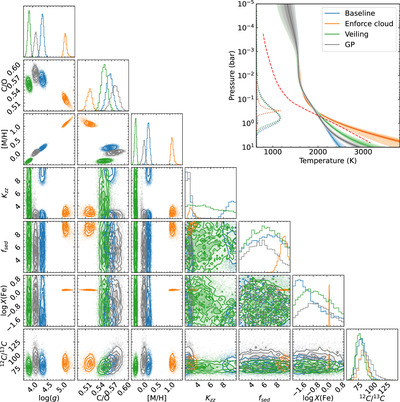
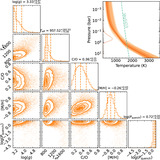
Caption: Figure 5.
Comparison of retrieval results of alternative models for YSES 1 b. Blue represents the baseline model, orange shows the enforced (optically thick) cloud model, green represents the model with veiling effect, and gray is the model with GPs accounting for correlated noise. The upper right-hand panel shows the retrieved T–P profiles. Different color saturations indicate the envelopes of 1σ, 2σ, and 3σ intervels. The red dashed line is the self-consistent T–P profile (T eff = 1900 K,log g = 4.0) from the Sonora Bobcat model grid. The dotted curve shows the flux-weighted emission contribution of each model. The corner plots show the posteriors of free parameters, including surface gravity, C/O ratio, metallicity, vertical mixing parameter, settling parameter, mass fraction of clouds at the cloud base, and carbon isotope ratio. We note the correlation between surface gravity and metallicity, while C/O and 12CO/13CO are less model dependent.
Other Images in This Article


Show More
Copyright and Terms & Conditions
© 2024. The Author(s). Published by the American Astronomical Society.