Image Details
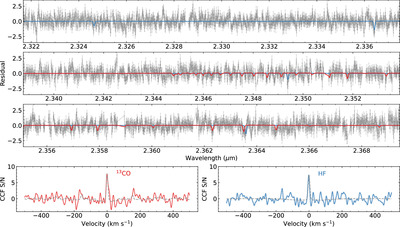
Caption: Figure 4.
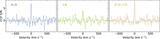
Detection of 13CO and HF molecules in CRIRES+ observations of YSES 1 b. The top three panels show the 2.32-2.37 μm observational residuals, where the main H2O and 12CO spectral features have been removed from the data. The best-fit 13CO and HF model spectra are overplotted in red and blue lines, demonstrating the detection of individual lines in the data. The bottom panels display CCFs of observational residuals with 13CO and HF models. The gray dashed line is each molecular model’s ACF.
Other Images in This Article

Show More
Copyright and Terms & Conditions
© 2024. The Author(s). Published by the American Astronomical Society.
Copyright ©
2025 Astronomy Image Explorer. All Rights Reserved.