Image Details
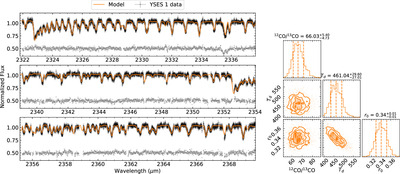
Caption: Figure 8.
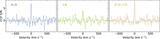
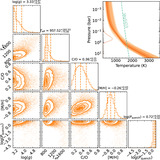
Spectral analysis of the YSES 1 primary to retrieve the stellar carbon isotope ratio. Left-hand panels show a portion of the CRIRES+ spectra in black, the best-fit PHOENIX stellar model in orange, and the residuals in gray (with an offset by 0.5). The right-hand panel shows the posterior distribution of the retrieved 12CO/13CO ratio, disk temperature T d , and the veiling amplitude r 0.
Other Images in This Article


Show More
Copyright and Terms & Conditions
© 2024. The Author(s). Published by the American Astronomical Society.
Copyright ©
2025 Astronomy Image Explorer. All Rights Reserved.