Image Details
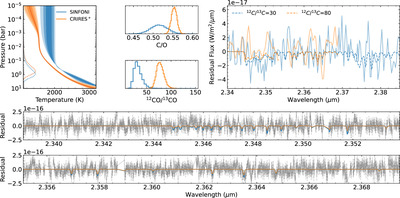
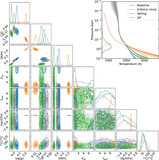
Caption: Figure 11.
Comparison of the CRIRES+ (orange) and SINFONI (blue) data and retrieval results on YSES 1 b. The left-hand and middle panels show the posteriors of the T–P profile, C/O, and 12CO/13CO ratios. The right-hand panel compares the observational residuals of the SINFONI data and the down-convolved CRIRES+ data in solid lines and their best-fit 13CO models in dashed lines. The two bottom panels show the observational residuals of the CRIRES+ data, like in Figure 4, overplotted with the retrieved best-fit 13CO models from both CRIRES+ (orange) and SINFONI (blue) data.
Other Images in This Article


Show More
Copyright and Terms & Conditions
© 2024. The Author(s). Published by the American Astronomical Society.
Copyright ©
2025 Astronomy Image Explorer. All Rights Reserved.