Image Details
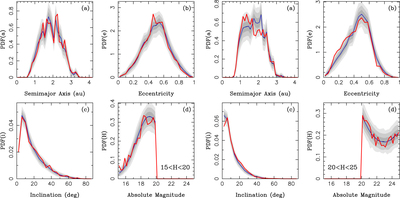
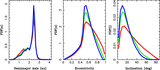
Caption: Figure 12.
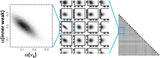
The PDFs of a, e, i, and H from our biased base best-fit model (blue lines) are compared to the CSS NEO detections (red lines). The four panels on the left show the results for bright NEOs with 15 < H < 20, and the four panels on the right show the results for faint NEOs with 20 < H < 25. The shaded areas are 1σ (bold gray), 2σ (medium), and 3σ (light gray) envelopes. See caption of Figure 11 for the method that we used to compute these envelopes. For 20 < H < 25, the K-S test probabilities are 10−4 and 0.012 for the a and e distributions, respectively.
Other Images in This Article

Show More
Copyright and Terms & Conditions
© 2023. The Author(s). Published by the American Astronomical Society.
Copyright ©
2025 Astronomy Image Explorer. All Rights Reserved.