Image Details
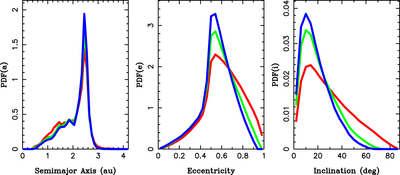
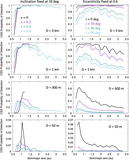
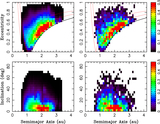
Caption: Figure 7.
The orbital distributions of NEOs from the 3:1 source for three disruption thresholds: q* = 0.005 au (red line), q* = 0.1 au (green line), and q* = 0.2 au (blue line). By increasing the disruption distance in the model, we remove the orbits with high eccentricities, and the eccentricity distribution becomes more peaked near e = 0.5. At the same time, the inclination distribution becomes narrower.
Other Images in This Article

Show More
Copyright and Terms & Conditions
© 2023. The Author(s). Published by the American Astronomical Society.
Copyright ©
2025 Astronomy Image Explorer. All Rights Reserved.