Image Details
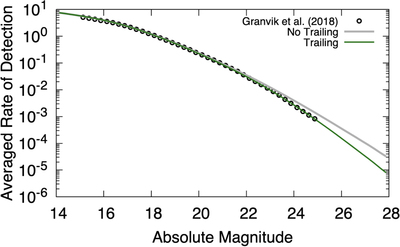
Caption: Figure 4.
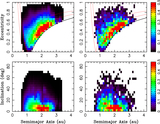
The CSS’s mean rate of detection—the number of CSS FOVs in which an NEO with given orbital elements is expected to be detected—is plotted as a function of the absolute magnitude (green line). The average of ﹩{ \mathcal R }(a,e,i,H)﹩, given in Equation (4), was computed over the whole orbital domain. The original bias from Granvik et al. (2018) is shown by open circles. The gray line shows the detection rate when the trailing loss from Zavodny et al. (2008) is not accounted for.
Other Images in This Article

Show More
Copyright and Terms & Conditions
© 2023. The Author(s). Published by the American Astronomical Society.
Copyright ©
2025 Astronomy Image Explorer. All Rights Reserved.