Image Details
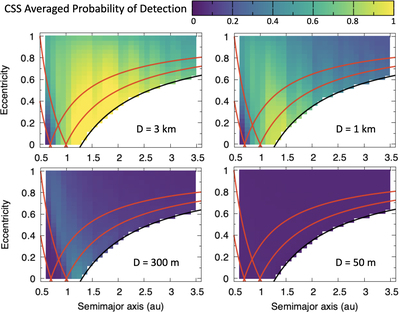
Caption: Figure 5.
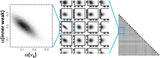
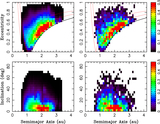
The CSS detection probability (Equation (5)) as a function of orbital elements for four different absolute magnitude values. From top left to bottom right, we plot ﹩{ \mathcal P }(a,e,i,H)﹩ for H corresponding to objects with D = 3 km, 1 km, 300 m, and 50 m (H = 15.37, 17.75, 20.37, and 24.26 for the reference albedo p V = 0.14). The detection probability was averaged over all inclinations bins. The vertical strips, with ﹩{ \mathcal P }﹩ going up and down as a function of the NEO’s semimajor axis, are discussed in the main text.
Other Images in This Article

Show More
Copyright and Terms & Conditions
© 2023. The Author(s). Published by the American Astronomical Society.
Copyright ©
2025 Astronomy Image Explorer. All Rights Reserved.