Image Details
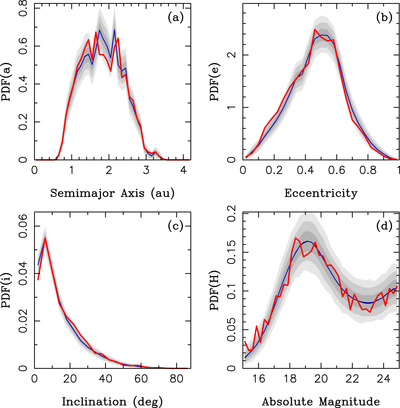
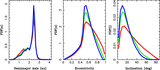
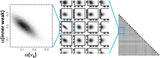
Caption: Figure 11.
The probability density functions (PDFs) of a, e, i, and H from our biased base best-fit model (blue lines) and the CSS NEO detections (red lines). The shaded areas are 1σ (bold gray), 2σ (medium), and 3σ (light gray) envelopes. We used the best-fit solution (i.e., the one with the maximum likelihood) from the base model and generated 30,000 random samples with 3803 NEOs each (the sample size identical to the number of CSS’s NEOs in the model domain; 15 < H < 25). The samples were biased and binned with the standard binning (Table 2). We identified envelopes containing 68.3% (1σ), 95.5% (2σ), and 99.7% (3σ) of samples and plotted them here. The K-S test probabilities are 9.7%, 14%, 32%, and 61% for the a, e, i, and H distributions, respectively.
Other Images in This Article

Show More
Copyright and Terms & Conditions
© 2023. The Author(s). Published by the American Astronomical Society.