Image Details
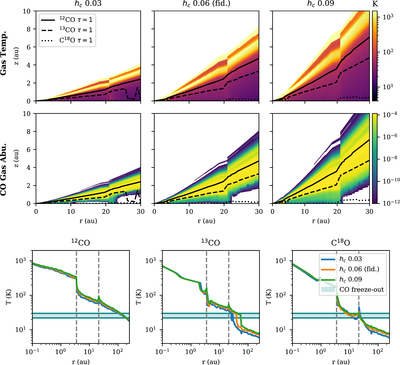
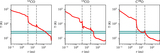
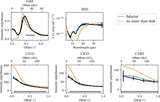
Caption: Figure 26.
Same as Figure 21, but for the comparison of different values of h c within 30 au, as described in Section 5.2.4. First row: gas temperature; second row: CO gas abundance; third row: comparison of the gas temperature at the τ = 1 surface for the 12CO, 13CO, and C18O lines.
Other Images in This Article
Show More
Copyright and Terms & Conditions
© 2022. The Author(s). Published by the American Astronomical Society.
Copyright ©
2025 Astronomy Image Explorer. All Rights Reserved.