Image Details
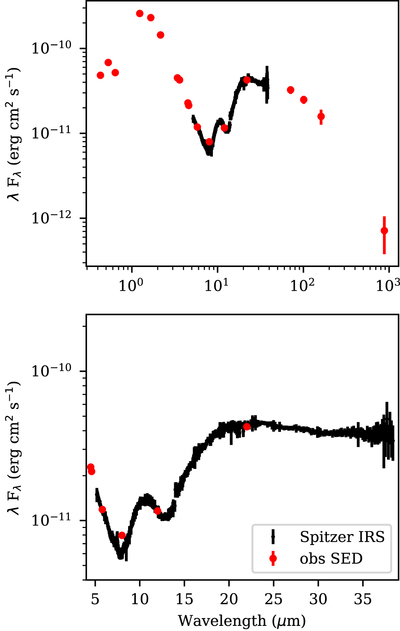
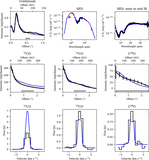
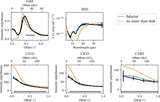
Caption: Figure 3.
Spectral energy distribution for DM Tau; red circles are photometric measurements, black dots are Spitzer IRS spectra. Top panel: overall SED. Bottom panel: zoom in on the near-to-mid infrared portion.
Other Images in This Article
Show More
Copyright and Terms & Conditions
© 2022. The Author(s). Published by the American Astronomical Society.
Copyright ©
2025 Astronomy Image Explorer. All Rights Reserved.