Image Details
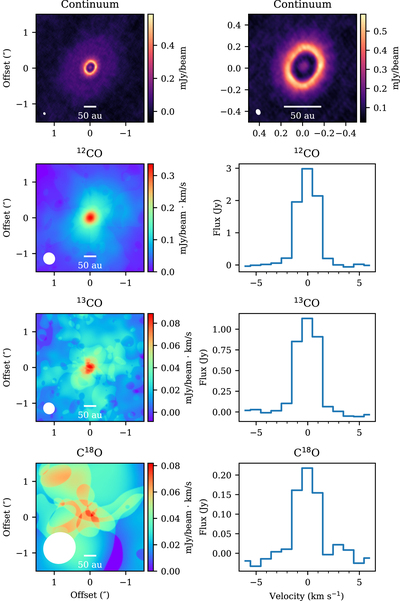
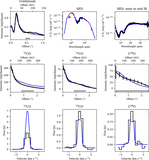
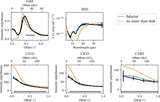
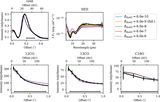
Caption: Figure 1.
Top panels: 1.3 mm dust continuum images of DM Tau and zoom in on the 21 au dust cavity. Lower-left panels: moment 0 maps of each observed CO line. Lower-right panels: flux of each CO line integrated over the disk vs. the velocity. The beams for the continuum and moment 0 images are shown in the bottom left of each panel as white ellipses.
Other Images in This Article
Show More
Copyright and Terms & Conditions
© 2022. The Author(s). Published by the American Astronomical Society.
Copyright ©
2025 Astronomy Image Explorer. All Rights Reserved.